5 Tips to Improve Report Performance in Quickbase
Apr 26, 2023Are your Quickbase reports loading as slow as the line at Starbucks at 8am on a Monday? Or at least as slow as the line feels when you haven't had your venti four-shot hot soy latte (no? just me?).
Fear not my friend!
I've gathered 5 tips to help you improve the performance of your Quickbase reports.
#1 Fields: Less is more!
If you're looking to make your Quickbase reports load lightning fast, then you gotta cut down on the extra baggage. That's right, I'm talking about the number of fields you're putting into your reports.
To accelerate the load time, you'll not only want to limit the number of fields in general but also limit the use of derived fields. These are fields like formulas or summaries that get their value from other fields.
I know it can be tough to cut down on the number of fields, but consider this, if users have to scroll more than a small amount to see the data... it might be better to break the report into multiple reports.
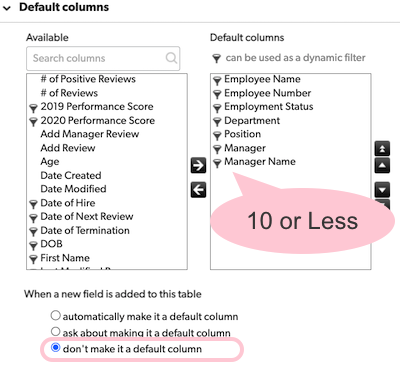
And, if you want to set yourself up for later success, make sure your default report includes fewer than 10 fields and has "When a new field is added to this table" set to "don't make it a default column". It's not uncommon for new reports to begin with the default field set.
To access the default report setting: open the table's settings for Reports & Charts, and select "Default Report Settings" from the "Default Settings" dropdown menu on the upper right.
#2 Filters: Order matters!
Filters are like the bouncers at a club. They determine who gets in and who doesn't. And just like at the club, the faster they can check your ID, the faster you can get in and get your groove on. So, to make your reports perform their best, you need to make sure your filters are working efficiently.
Start by kicking out the riff-raff. Include filters that remove the most records first to speed up the process.
And then...
- Use "equals" instead of "contains" whenever you can
- Place "and" conditions before "or" conditions
- Filter on scalar fields (ie the fields you manually populate) before formula and other derived fields like summaries
- Condense groups of common filters into a single checkbox formula field (using similar best practices in the formula) BONUS Tip you can reuse this checkbox in the filter for multiple reports and only need to update it in one place if the criteria change!
Lastly, let the user do the heavy lifting. "Ask the user" filters can help speed up your report by allowing the user to input the specific criteria they're looking for before the report loads.
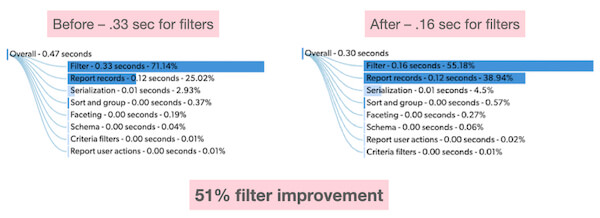
Optimizing Filters Example:
Inventory table with 11,681 records, filtered to 1,671 using 3 filters recorded to remove most records first.

Tip: click next to the filter until it turns yellow to access the "up/down" arrows on the left.
#3 Sort and Group: Use sparingly!
Sorting and grouping - it's like organizing your sock drawer, but for your Quickbase reports.
Just like you wouldn't waste your time sorting your socks by color if they're all white, you shouldn't waste your report's time sorting fields with lots of duplicate values.
And just like you wouldn't try to sort your socks by how soft they are, you shouldn't try to sort fields that require complex calculations. Instead, sort by fields with unique (or near unique) values, like Record ID#, Date Created, Date Modified, Email, Phone Number, Address etc.
And if you can avoid it, sort by numeric fields over text fields.
Optimizing Sort Example:
An inventory report is sorted by "Set Name" a standard text field compared to sorting by "inventory_id" a text field that requires unique values (also the table's key field).
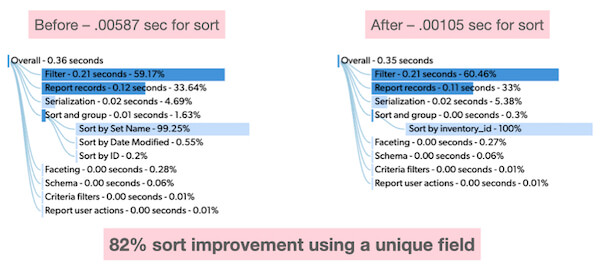 Notice in the left image the additional sort criteria for "Date Modified" and "ID". These were automatically added so that every record has a place in the sort since "Set Name" is not unique.
#4 Row Color Coding: Do you need it?
Have you ever spent hours trying to pick the perfect color scheme for your report, only to realize that no one even knew what the colors meant? While row colors may make your report look prettier, they can also slow down report performance.
Each color you add requires additional calculations, which can add up quickly for larger reports. So before you go wild with colors, ask yourself: do you really need them?
Now don't get us wrong, we love a good color scheme as much as the next person. But if it's not adding any value to your report, it's probably not worth the trade-off in performance.
So unless you absolutely need row colors, it's best to stick with the default settings and save yourself the trouble.
Optimizing Row Color Example:
An inventory report with a single color applied with a 'contains' formula compared to no row colors.
Note there is still a small amount of time for the system to check if row colors should be added.
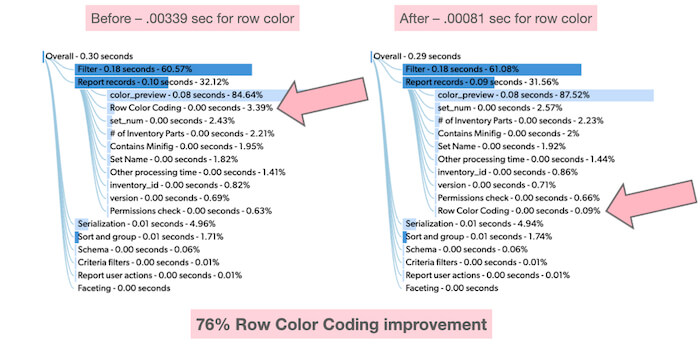
These durations may seem minuscule, but they all add up to 'slowness' that users feel.
#5 Reports: Delete at will!
Having a ton of reports may make it seem like your app is getting its money's worth, but it can also make finding the right report feel like searching for a needle in a haystack. So if you want to make your life easier (and your users too), it's time to clean house
Here's the type of criteria I use to get rid of the clutter:
- Any personal reports owned by someone who has been deactivated (they'll be easy to see in red text in the app's "Manage Reports" view).
- Reports last used more than 3 years ago (or whatever may be appropriate for your app).
- Reports that have never been viewed, have only been viewed a handful of times (caution these may be used in record pickers), or those that were last viewed a long time ago.
But wait, don't get click-happy just yet. You may want to give your users a heads-up by moving the soon-to-be-deleted reports to a "TO BE DELETED on X Date" group in the report menu. This way, any must-have reports can be rescued before you hit the delete button.
BONUS #6 Caching: Enterprise plans only!
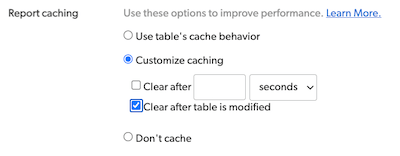
Enterprise users can enable the report caching feature, which stores a copy of your report's data in memory. This means that the next time you access your report, Quickbase can pull the data directly from memory instead of querying the database again.
Report caching can dramatically improve the performance of frequently accessed reports, which is great news for those of you who spend a lot of time running the same reports over and over again.
It's important to note that caching is by User (to ensure role permissions are enforced) and can be set at the table and report level with several different behaviors that vary in performance impact and data accuracy.
Yes, I said data accuracy. Depending on the cache settings, updates to the data may not immediately display. So, use this with caution and on tables less likely to be frequently modified.
This help article from Quickbase has all the details.
Summary
By following these 5 tips, you will improve the performance of your Quickbase reports, create a better user experience, and probably get back some time that would have been spent staring at the blue loading circle of doom... maybe enough time to go get another coffee ☕️
More from the Quickbase Optimization Series
- 7 Ways to Improve User Experience
- More Coming Soon!


