Dazzling Dashboard KPI Widgets in Quickbase
Jul 12, 2022I was recently asked by a client of mine, "Is there much in the way of good KPI Widget documentation out there aside from the conference videos? I just can't seem to find much out there."
He wasn't missing something.
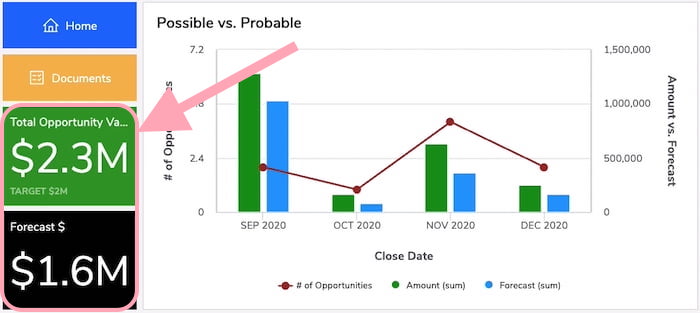
How to add the bold KPI Widgets to the new style Dashboards is not obvious.
This video will show you how and provide a few tips along the way!

Steps to adding a KPI Widget:
- Open the table with the data to be displayed in the KPI Widget
- Add a new "Chart" report

- Choose the "Gauge" style chart

- Select the field with the KPI

- (Optional) Add a goal

- (Optional) Adjust the color ranges

- (Optional) Update the colors in the legend

- Add report filters as necessary
- Save the report

- Open the Dashboard you want to add the KPI Widget to
- Click on the lock icon to 'unlock' (located in the upper right corner)
- Click on the area you want to add the KPI and choose Report
- Select the table with the KPI data then select the Gauge report
- Update the KPI Widget settings (style, title, target, etc)

- Click Add to Dashboard
- Enjoy your new KPI Widget!

More Dashboard Videos:
5 Old to New Dashboard Navigation Tips (8 min)
Understanding the KPI Delta (coming soon)
Multi Report Dashboard Filters (coming soon)
Adding Reports from Other Apps (coming soon)
Feeling like a Junkie? Subscribe Now!


